Tag
data visualization
-

Your step by step guide to using rawgraphs for beginners with examples
Rawgraphs isn’t just another data visualization tool—it’s a browser-based platform that transforms raw datasets into polished, publication-ready visualizations...
-

The Art of Precision: How to Collect and Analyze Datapoints for Market Research That Drives Decisions
Yet most organizations stumble at the first hurdle—deciding what to measure and how to measure it. The gap between collecting data and deriving meaning is...
-

Transform Your Data into Insights: How to Use Apache Superset for Data Visualization
The platform’s strength lies in its dual nature: it serves as both a self-service tool for business users and a robust backend for data engineers. For...
-

The Future of Data Visualization: Best Superset Dashboards for Business Analytics 2026
Business analytics has evolved beyond static reports and siloed data silos. Today, organizations demand dynamic, interactive, and scalable dashboards that turn...
-

Superset vs Tableau for Small Teams: The Right Choice for Agile Analytics
When a small team’s analytics needs outgrow spreadsheets but budgets refuse to stretch to enterprise pricing, the choice between Apache Superset and Tableau...
-
How to Create Interactive Dashboards in Apache Superset for Beginners: A Step-by-Step Blueprint
The appeal of Superset lies in its balance: it doesn’t require fluency in JavaScript to build rich visualizations, yet it provides hooks for custom JavaScript...
-

Seamless Data Flow: How to Connect Superset to Google BigQuery for Data Visualization
Data visualization is no longer a luxury—it’s a necessity for organizations that thrive on insights. Yet, bridging the gap between raw data and actionable...
-

Uncovering the Best Superset Alternatives for Small Business Dashboards in 2024
Apache Superset has long been a favorite for data-driven organizations, but its complexity and resource demands often make it a poor fit for small businesses...
-

How to Create a Dashboard in Superset for Sales Analytics: A Step-by-Step Masterclass
Sales analytics dashboards don’t just present data—they transform raw numbers into strategic insights, revealing patterns, forecasting trends, and identifying...
-

Navigating Complexity: The Best YAML Editors for Complex Data Structures in 2024
The stakes are higher than ever. A misplaced colon or improperly aligned list in a YAML file can cascade failures across microservices or render entire...
-

Unlocking Real-Time Insights: How to Use Rhombus Power for Log Analysis
What sets this approach apart is its ability to visualize log data as a three-dimensional rhombus structure —a geometric metaphor for correlating time, event...
-

Transform Your Data into Dynamic Insights: How to Build Interactive Dashboards with Cubo AI
The ability to transform raw data into actionable insights is no longer a luxury—it’s a competitive necessity. Yet, traditional BI tools often demand steep...
-

Unlocking Efficiency: Grafana Labs Dashboard Templates for IoT Monitoring Free
The challenge lies in balancing complexity and usability. Many organizations struggle to extract meaningful patterns from raw sensor data, often drowning in...
-

Step-by-Step: How to Build a CRM Dashboard in Retool for Beginners
The appeal of Retool lies in its flexibility. Unlike off-the-shelf CRM platforms, which lock you into rigid templates, Retool adapts to your specific...
-
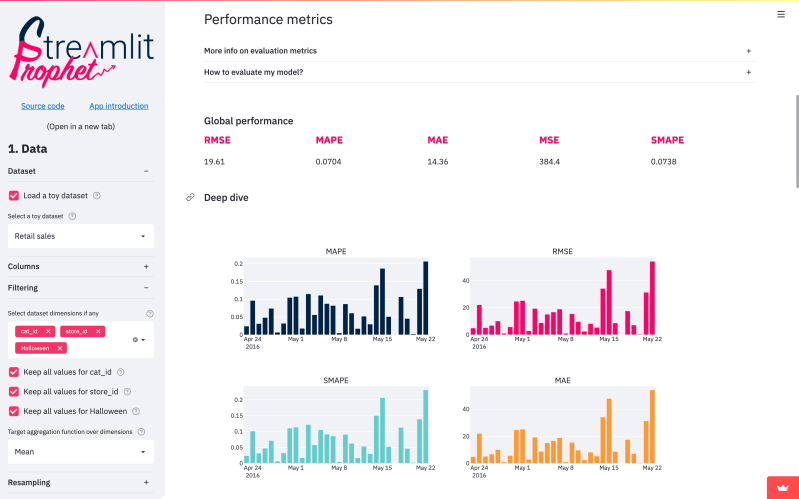
Choosing the Right Tool: Streamlit vs Dash Python for Data Visualization Tools
Data visualization isn’t just about pretty graphs—it’s the bridge between raw analytics and actionable insights. When Python developers and data professionals...
-

Deploying Streamlit Apps for Free: The Definitive Heroku Walkthrough
The integration between Streamlit and Heroku hinges on two key factors: Heroku’s support for Python-based web dynos and Streamlit’s ability to run as a...
-
Crafting Data Stories: The Best Streamlit Tutorials for Building Interactive Dashboards That Engage
The best Streamlit tutorials for building interactive dashboards don’t just teach syntax; they demystify the art of user experience within technical...
-

Streamlit vs Dash Python for Data Apps: The Definitive Showdown
The decision between Streamlit vs Dash Python for data apps isn’t just about picking a tool—it’s about aligning your project’s technical demands with the right...
-

The Definitive Guide to Streamlit Dashboard Templates for Stunning Data Visualization
Data visualization has long been the silent architect of clarity in complex datasets, transforming raw numbers into actionable insights. Yet, the tools that...
-
Streamlit vs Dash Python: Which Is Better for Beginners?
Python’s dominance in data science and analytics has birthed powerful tools for building interactive web applications—Streamlit and Dash Python chief among...
